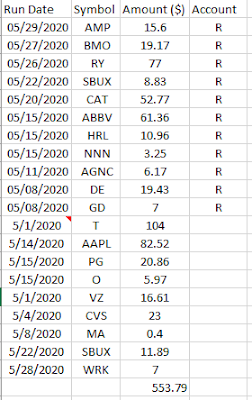
Welcome to the November Dividend Analysis Report, where we explore and dissect the dividends received from a diverse portfolio of stocks in the month of November 2023. Let's delve into the financial performance of each stock and uncover the key trends that shaped the dividend landscape
| Stock | 2020 | 2021 | 2022 | 2023 |
| VZ | 16.94 | 36.95 | 64.81 | 72.43 |
| T | 52.52 | 56.4 | 31.73 | 33.82 |
| CVS | 23.5 | 25.69 | 28.89 | 34 |
| MA | 0.52 | 1.01 | 4.45 | 7.66 |
| WRK | 7.05 | 8.96 | 14.77 | 17.86 |
| SBUX | 13.12 | 14.51 | 19.8 | 24.36 |
| DE | 19.43 | 26.91 | 29.3 | 35.43 |
| BMY | 0 | 29.4 | 49.24 | 57.53 |
| AGNC | 6.17 | 6.44 | 7.66 | 8.85 |
| GD | 21.42 | 29.82 | 32.29 | 34.395 |
| NNN | 3.28 | 3.79 | 4.125 | 4.4525 |
| HRL | 10.96 | 11.67 | 15.84 | 17.1825 |
| ABBV | 61.36 | 75.53 | 88.1673 | 97.7075 |
| AAPL | 82.52 | 88.84 | 93.41 | 98.05 |
| CAT | 52.77 | 57.41 | 63.46 | 70.155 |
| AMP | 15.71 | 17.22 | 19.37 | 21.2575 |
| SBUX | 9.7 | 10.64 | 13.3 | 14.6075 |
| RY | 8.38 | 10.26 | 13.42 | 14.6325 |
| T | 52.52 | 55.44 | 30.83 | 30.83 |
| O | 6.23 | 6.41 | 7.55 | 8.45 |
| PG | 20.86 | 23.23 | 26.83 | 28.34 |
| 484.96 | 596.53 | 659.2423 | 732 |
Here's the year-over-year growth in total dividends received:
- 2020 to 2021: Growth of $111.57 (23.01% increase)
- 2021 to 2022: Growth of $62.71 (10.52% increase)
- 2022 to 2023: Growth of $72.76 (11.05% increase)
The yearly growth percentages indicate a positive trend in the increasing dividends received over the specified years. This suggests that the dividend income has been growing steadily, with a notable increase from 2020 to 2021 and continued growth in the subsequent years.
2023 YTD Goal:
Let's analyze the Year-to-Date (YTD) dividends for the year 2023 and compare it to the stated goal:
- YTD Dividend for 2023: $13,163.16
- Goal for 2023: $17,000
The YTD dividend of $13,163.16 represents the total dividends received up to the current point in 2023. Comparing this to the goal of $17,000, there is a shortfall of $3,836.84 to reach the annual dividend goal.


